



Why RAS needs closer monitoring than a pond
A pond holds a lot of water per kg of fish and changes slowly. A RAS holds far more fish per cubic metre and depends on pumps, blowers and oxygen running all day. If one fails, dissolved oxygen can fall to dangerous levels within minutes to an hour, depending on density and temperature. The same density that makes a RAS productive also leaves less time to react.
Monitoring in a RAS therefore has two jobs. Routine tests show slow trends, such as alkalinity falling or nitrate building up. Continuous sensors with alarms catch fast failures, above all a fall in oxygen.
The parameters and typical ranges
The ranges below are common working ranges for warm-water freshwater grow-out. Targets differ by species, life stage and salinity, so treat them as a starting point and confirm them for your fish.
| Parameter | Typical working range | What drives it |
|---|---|---|
| Dissolved oxygen | Above about 5–6 mg/L at the tank outlet; cold-water species often higher | Fish and bacteria respiration, oxygen supply |
| Temperature | Species-specific, held steady | Climate, heating or chilling, pump heat |
| Total ammonia nitrogen (TAN) | Below about 1–2 mg/L; lower for sensitive species | Feed, biofilter performance |
| Nitrite (NO₂-N) | Below about 0.5–1 mg/L | Biofilter maturity and balance |
| Nitrate (NO₃-N) | Controlled by water exchange; tolerance varies widely by species | End product of nitrification, water exchange rate |
| CO₂ | About 10–20 mg/L cold water, 20–40 mg/L warm water | Respiration, degassing |
| pH | About 7.0–8.0, held steady | Nitrification, CO₂, alkalinity dosing |
| Alkalinity | About 100–150 mg/L as CaCO₃ | Nitrification, bicarbonate dosing |
| Total suspended solids | As low as the solids line allows | Feed, drum filter and settler performance |
| Salinity | Held steady in brackish and marine systems | Evaporation, make-up water |
CO₂ ranges are from FloNergia. CO₂ matters more than many buyers expect: in a pikeperch trial, raising CO₂ from 5 to 30 mg/L worsened feed conversion from 1.09 to 1.82 (Frontiers). Poor water quality often shows up first as poor growth and feed conversion, before fish are lost.
How often to measure
| Parameter | Frequency | Method |
|---|---|---|
| Dissolved oxygen | Continuous, every tank or tank group | Online optical sensor with alarm |
| Temperature | Continuous | Online sensor, often built into the oxygen probe |
| Water level | Continuous in sumps and critical tanks | Level switch or sensor with alarm |
| pH | Daily, or continuous where dosing is automated | Calibrated meter or online probe |
| TAN and nitrite | Daily during start-up and after changes; then two to three times a week | Test kit or photometer |
| Alkalinity | Two to three times a week | Titration kit |
| Nitrate | Weekly | Test kit or photometer |
| CO₂ | Weekly, and when fish feed poorly | Test kit, or calculated from pH and alkalinity |
| TSS or turbidity | Weekly, or when the water looks cloudy | Turbidity meter or lab test |
Which ones need alarms
Alarms are for failures that can kill fish before the next manual check. On most farms these are:
- Low dissolved oxygen in tanks, and low oxygen supply pressure.
- Low water level in sumps, which can run pumps dry or drain tanks.
- Power failure and pump or blower stop.
- Temperature out of range where heating or chilling is used.
An alarm only helps if it reaches someone who can act, at night and at weekends. Phone calls or text messages to more than one person are the minimum. More advanced monitoring and control also acts on its own: opening backup oxygen or starting a standby pump when a value goes out of range. RAS backup planning covers what should happen after the alarm.
Where to measure
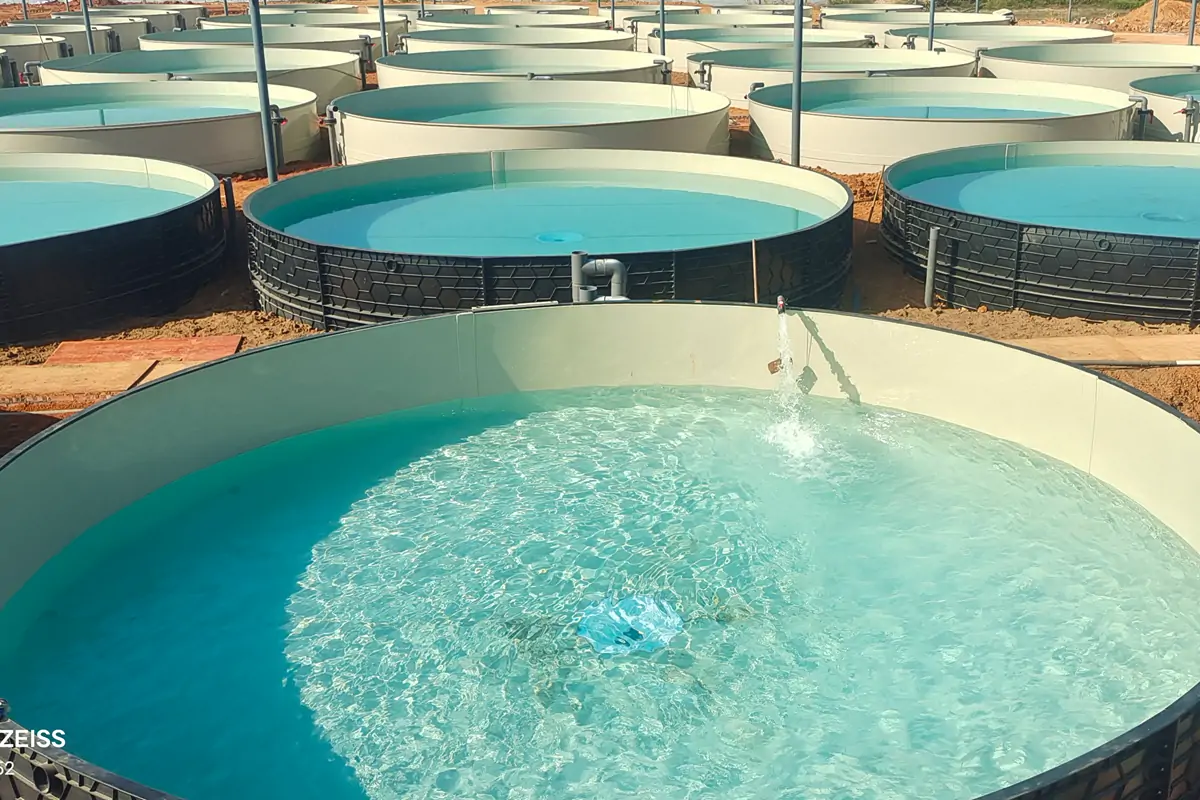
- Oxygen at the tank outlet, where it is lowest, not at the inlet.
- Ammonia and nitrite before and after the biofilter, to see how much it removes.
- pH and alkalinity in the sump, where the water is mixed.
- At the same time each day. Readings change through the day, and are usually worst a few hours after feeding.
Reading the trends
| What you see | Likely cause | Where to look |
|---|---|---|
| Ammonia rising slowly | Feed has outgrown the biofilter, or alkalinity is low | Feed records, alkalinity, biofilter aeration |
| Nitrite peak | Biofilter immature or recently disturbed | Start-up guide |
| pH and alkalinity falling | Bicarbonate dose too low | Alkalinity and pH |
| Oxygen dips after feeding | Oxygen sized on average demand | Oxygenation guide |
| Fish eat less, CO₂ high | Degassing undersized or blocked | Degassing tower |
| Cloudy water | Solids line overloaded or bypassing | Drum filter backwash and screen |
Keep a log
Record every reading with the date, time, feed given and any action taken. A log turns single readings into trends, shows whether a change worked, and gives your supplier the information needed to help when something goes wrong. Many farms keep it in a simple spreadsheet; larger farms log sensor data automatically.
Build it into the design
Sensor positions, alarm outputs and the backup actions they trigger are much easier to install with the system than to add later. Send your species and target output, and we include the monitoring plan in the first layout.